

Hey everyone! It’s Sabrina and today I am doing a very self-centred post, because I’m talking you through my stats and information that The StoryGraph website provides me with. I know I love seeing people’s reading stats, no matter whose they are, so hopefully this will be somewhat interesting to some people!
*Also, I feel like I should mention that this is not a sponsored post, lol

First of all, if you haven’t heard of The StoryGraph before, you are in for a treat because I am about to introduce you to an amazing website. It helps you track your reading, like Goodreads but it has a greater focus on helping you find your next favourite book. It’s still in beta mode and they are adding new features pretty frequently, so there is always something new to look forward to. If you want to add me, this is my profile and please send me yours too!
In this post I’m going to be comparing three sets of information: this year’s, my TBR’s and my all-time stats. A lot of this relies on the way books are sorted on the website, which I believe is done by the reviews of readers and I don’t always necessarily agree with them, lol. It should also be stated that I put these graphs together myself because I wanted the colours to go with the blog better, but they are copied directly from The StoryGraph. And finally, I’m sorry the images are so small 😦 I did my best. You can open them in a new tab if you need to and they’re a fair bit bigger that way – particularly the “mood” one.
PACE
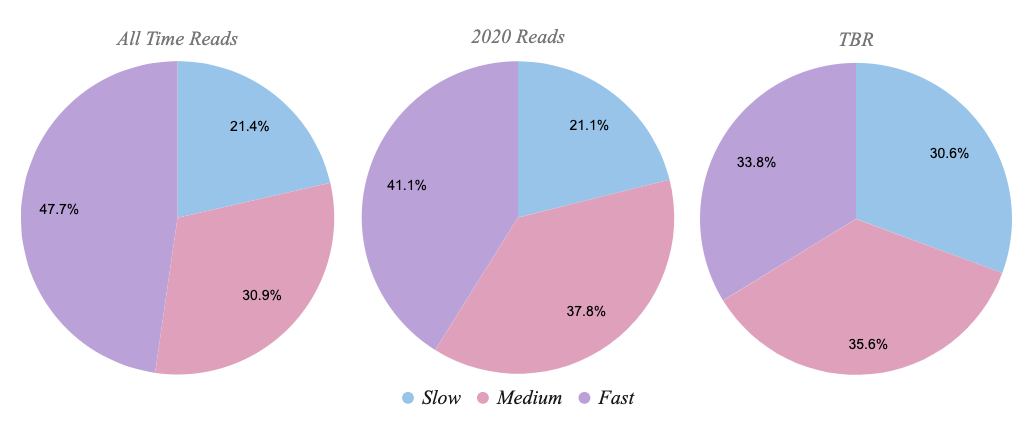
As you can hopefully see by these graphs, I have a relatively equal percentage of slow, medium and fast paced books on my TBR, however in both my all-time and 2020 reading, I read significantly less slow paced books. This year, I’ve read slightly more fast paced books than medium paced books, and my all time stats show that I have been far more likely to read fast paced books over time. I think this reflects my actual preferences pretty well, because a slow paced book has to be done really well if it’s going to keep my attention and a fast paced book will keep me interested in spite of other flaws.
MOOD
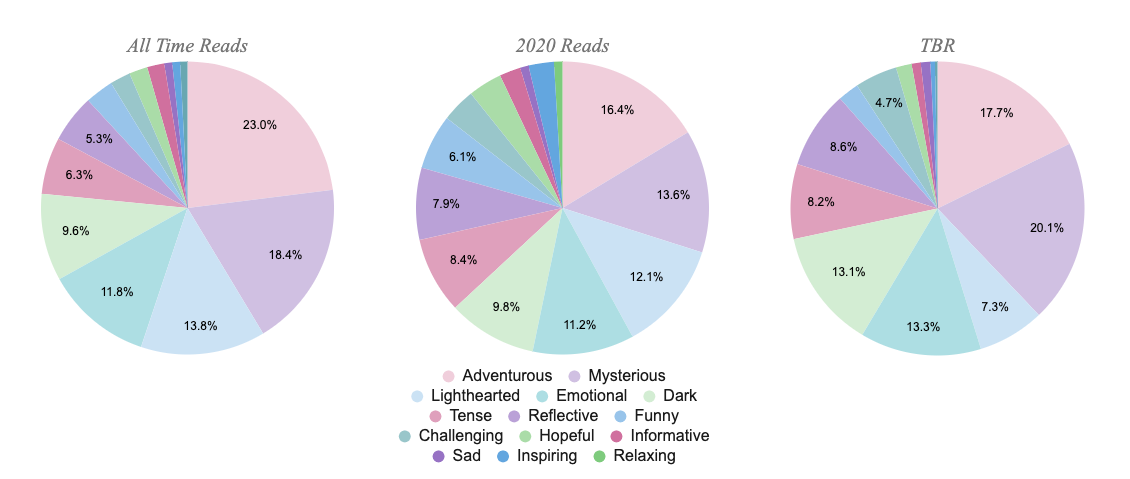
I think this is my favourite kind of information that the website records. I love filtering books to show me only certain moods. It’s also fun to see what books I’ve read that fit each category – because on the website, you can click on the wedges of the graph and it will show you what is counting toward that number. Anyway, you can see by these graphs that whilst the order of moods are mostly the same for my all time reading and my 2020 reading, there are some differences in percentages. My percentage of adventurous books read this year has gone down a bit compared to all time, which is, to be honest, a little bit sad to me. I am glad, however, to see that I’ve read a higher percentage of funny books this year, because I feel like that’s something I’ve been lacking over my reading journey. I hope to see that keep going up!
My TBR graph is actually a fair bit different to the other two, most notably when it comes to lighthearted books. There’s a much lower percentage of them on my TBR than in the other two graphs which concerns me a little. Although, I wonder if that means I just pick up lighthearted books on a whim, rather than planning to read them in the first place? There is also a slightly higher percentage of mysterious books on my TBR than adventurous books which is another difference with this graph. This doesn’t surprise me all that much – to be honest, I thought the difference would be greater – because I am much less picky with mystery/thriller books that I add to my TBR compared to probably any other genre.
PAGE NUMBER
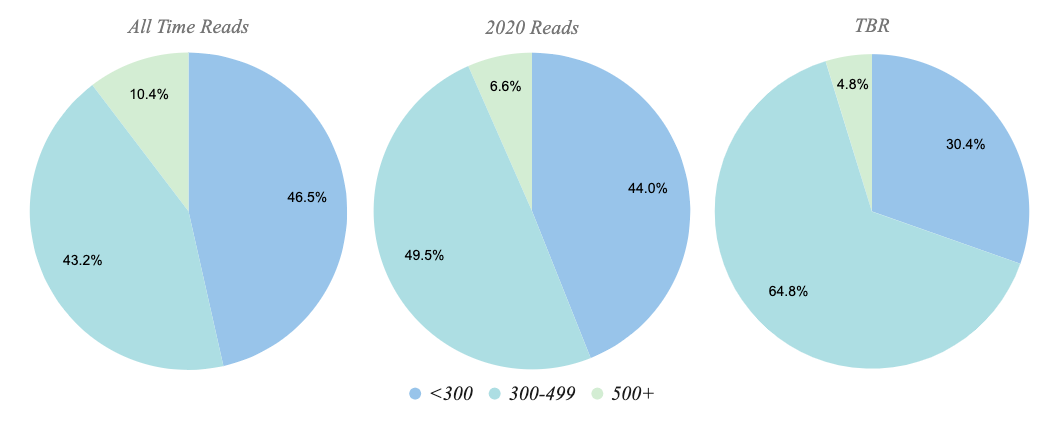
Of all the stats today, this set is probably the least surprising to me. I could be very wrong here, but I feel like this information is a reflection of an overall average within published books you’d find at the store. I’m sure if I exclusively read high fantasy novels the average would skew far toward long books and if I read exclusively graphic novels it would lean toward the short side, but I am not so specific with my taste. There is a much greater percentage of mid-length books on my TBR than short or long books – it’s so noticeable that I couldn’t just not acknowledge it, lol – but I still think this reflects an overall average rather than my personal taste. What do you think?
FICTION VS NONFICTION
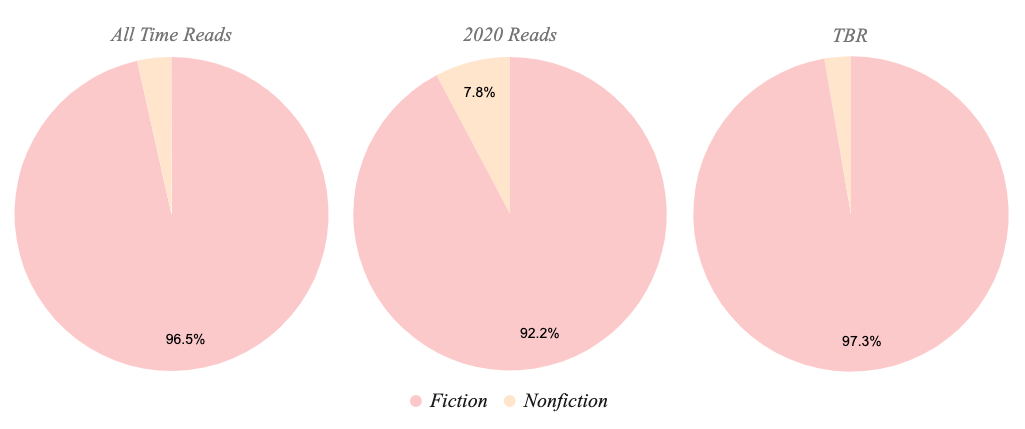
This year I have read a significantly higher percentage of nonfiction books than is seen in my all-time stats or TBR. It’s still, of course, a whole lot lower than the percentage of fiction books that I read, but I am glad to see that after some effort this year I have actually seen a difference in this statistic!
What do you think?
Have you got a profile on The StoryGraph? Are your statistics wildly different to mine? Do you find these kinds of statistics interesting? How many pages on average would you say the books you read are? Let me know!


I love pie charts!
(www.evelynreads.com)
LikeLike
Wow these are great stats to high and Im curious about my own preference with slow and fast paced books. I wish Storygraph had a mobile app!
LikeLike
Love this post! I love seeing charts and stats so much.
I also use The Storygraph, but I want to get better at it because I frequently forget to update my books on there. The stats are my favorite part of it because I love to look at them.
LikeLike
This is so cool! I’d never heard of StoryGraph before but I may have to check it out! 😀
LikeLike
I’ve heard of StoryGraph but I didn’t know they did pie charts!! I especially love the ones done about your TR and the makeup of your TBR. My TBR shelf on Goodreads right now is such a mess so I don’t even read books off of it anymore. Anyway, I am SUCH a sucker for charts and statistics in general (my yearly wrap-ups are like 80% graphs). I’m definitely going to be making a profile asap!
Laura @BlueEyeBooks
LikeLike
I’ve heard about StoryGraph, but I wasn’t convinced to join it until your post! I didn’t know they have statistics and pie charts! Now I need to register. 😅
LikeLike
Ooh, these stats are really interesting to look at! I made a profile on StoryGraph when I first heard about it but I’ve never really used it. This has inspired me to go back onto it and explore it a bit better!
I think you’re right about the page numbers – it’s more a reflection on the genres you read than any other preference.
LikeLike
I haven’t tried StoryGraph yet, but I love the idea of seeing all my reading statistics! I may have to set it up soon.
LikeLike